Discover issues with performance testing
• 8 minute read
performance testing, apdex, jmeter
Table of contents
It's incredible when your back-end project is well implemented in terms of unit and integration tests, covering most of the business rules that your application should respect to deliver what is expected for those who will use it. Now the moment has come! You think it's prepared to be deployed in production, and when you do, you start seeing some problems 😵💫 such as:
- The cache is not working correctly.
- The REST API is too slow for most of the requests.
- The database uses 100% of the CPU during peak hours, but it seems dead even in some basic circumstances.
- Some users receive data from other users, which could denote race conditions (or perhaps even worse things).
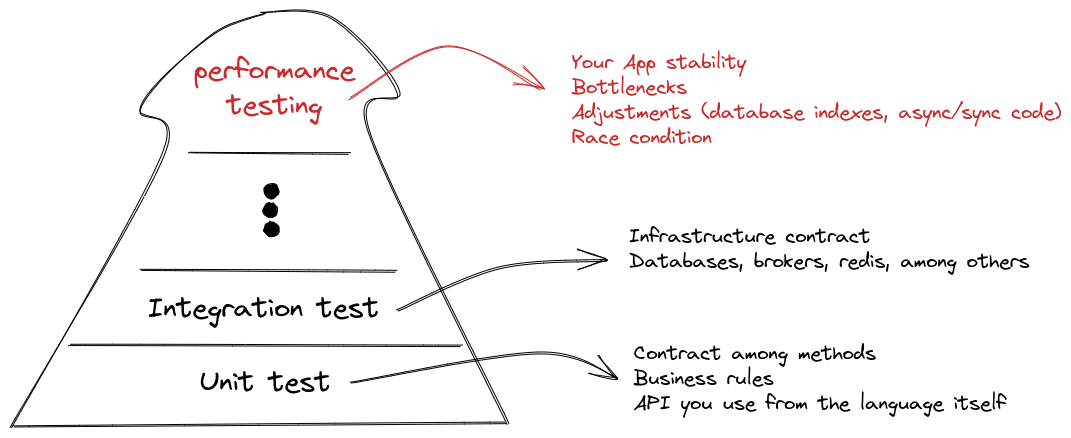
One way to mitigate these issues (and many others possibly) is doing performance testing. I'm not saying it will save you. Instead, it's another layer of protection that you can have beyond a code review process, let's say. But, of course, it may have some problem if it's not correctly implemented, so it will all depend. Here's an image that illustrates some gains that you have depending on which approach you're using (there are many, but I'm showing just some):

This is known as the test pyramid. As you can see above, you can identify bottlenecks with performance testing and some other situations. Before doing anything to create a test plan, it's a good idea to start with the functional requirements of your project, if it has one.
Gathering functional requirements
Before creating your performance testing script, it's a good idea to start answering how many requests your application should handle (in the case of a REST API), given its business requirements. To illustrate, imagine that your application is an ad-hoc one specially built to deal with incoming requests from your partners, and it should be capable of working with 3,500 requests per minute. In addition to that, your app should answer each request until the limit of 500 ms. There we go! We have something to start our script 😄. By the way, I'm roughly speaking here. I'm just giving a fictional example. Sometimes you might not even have this information 😬, which is why some measurements are required to retrieve that first. You can check out many cases from the setting performance goal on the Wikipedia article about the related topic.
Now, if you are in a condition where you have nothing, literally, then it's a good idea to start with the APDEX (Application Performance Index); besides, even if you have many cases, it's always fundamental to use APDEX.
Apdex: Measure user satisfaction
According to the APDEX official website:
The Apdex methodology was first described by Peter Sevcik in 2004. The objective was to have a simple and uniform open standard to report on application performance regardless of how it was measured.
The following is from Newrelic (which I think it's easier to understand):
It's a simplified Service Level Agreement (SLA) solution that helps you see how satisfied users are with your app through metrics such as Apdex score and dissatisfaction percentage instead of easily skewed traditional metrics such as average response time.
Now that we understand a few of what it is, which tool can we use? Furthermore, how can we apply it in our working flow 🤔?
JMeter
There are many tools out there like Gatling, Locust, and K6, but here I'll explain just a bit of JMeter. It is totally visual and pretty easy to follow and understand 🤗; it also includes a module that generates dashboards that gives us an APDEX result, which is what we want. By default, I have it on my system; you can use the same idea or simply download it from the official website and run it afterward.
Sample project and creating a script
We'll use the REST API Version of the Tic Tac Toe game that I have written using C#! Now let's see the performance test script. Ah! It's worth mention that I won't explain in detail each configuration step. JMeter has an excellent assistant feature. You just add a resource and click on the help icon. It will redirect you to the manual related to the same resource you added. It's awesome 😛. Thus, if you don't understand a given component, either go to the help page or comment below that I will happily help you 🤟.
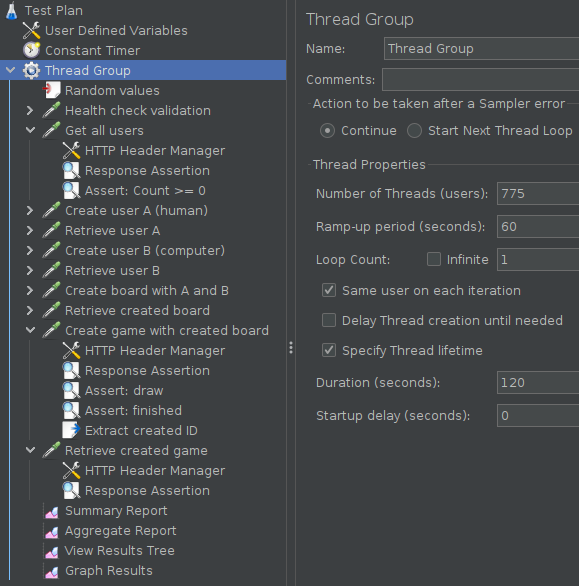
OK! Download this file and open it on your JMeter. You should see something like this:

The thread group is configured to meet our fictional functional requirement, including a safe margin. Thus we have the following:
- 775 users (threads). Each user will execute 10 requests (see the green dropper icon symbolizing an HTTP request), which means we will have 7750 samples.
- All the users will make their first request in 60 seconds. After this ramp-up, the test will be fully up to speed.
- Each user can live up to 120 seconds.
By default, JMeter has the following parameters configured, which are used for the APDEX formula:
- apdex_satisfied_threshold: Sets the satisfaction threshold for the APDEX calculation in ms. By default is 500.
- apdex_tolerated_threshold: Sets the tolerance threshold for the APDEX calculation in ms. By default is 1500.
If we run it (see this script), we may receive the following result:

This means that our test was asserted as expected 🚀! So now we get back to the question I wrote here previously: how do we implement it in our workflow? Our next topic 👀!
Simple workflow to start with
I believe half a loaf is better than none. So starting from this idea, with the help of containers, given our performance testing script is done and well tested, we can create a compose service to execute the test plan so that the result is available in some format. This output can be used to assert that the result matches our expectations. Look at this simple C# code that we can use to verify the result:
public class PerformanceTestingResultTest
{
    private JObject _generalStatistics;
    private JObject _applicationPerformanceIndex;

    [SkippableFact(DisplayName = "Should have no error in all requests")]
    public void TestScenario1()
    {
        // Arrange
        PreparePropertiesAndSkipTestIfNeeded();
        // Assert
        _generalStatistics.Count.Should().Be(11);

        foreach (var token in _generalStatistics)
        {
            var errorCount = token.Value["errorCount"].As<int>();
            errorCount.Should().Be(0);
        }
    }

    [SkippableFact(DisplayName = "Should APDEX result be greater than 0.9 to all evaluated requests")]
    public void TestScenario2()
    {
        // Arrange
        PreparePropertiesAndSkipTestIfNeeded();
        var rawOverallResult = _applicationPerformanceIndex["overall"]["data"];
        var rawRequestsResults = _applicationPerformanceIndex["items"];
        // Assert
        rawOverallResult.Should().NotBeNullOrEmpty();
        rawRequestsResults.Count().Should().Be(10);

        foreach (var token in rawRequestsResults)
        {
            var apdexResultForGivenRequest = token["data"][0].Value<double>();
            apdexResultForGivenRequest.Should().BeGreaterThan(0.9);
        }
    }

    private void PreparePropertiesAndSkipTestIfNeeded()
    {
        // Skip test if required
        var value = Environment.GetEnvironmentVariable("EVALUATE_PERFORMANCE_TESTING");
        bool.TryParse(value, out var shouldNotSkipTest);
        Skip.If(shouldNotSkipTest is false, "It was informed to be skipped");
        // General statistics
        _generalStatistics = FileHandler.ReadFileAsDictionary("tests-jmeter/statistics.json");
        // APDEX sadly is not in only one file, we should extract it
        var lineWhereApdexResultIs = @"createTable($(""#apdexTable"")";
        var regexPatternToCaptureResult = @", ({"".+]}), ";
        var dashBoardFile = FileHandler.EnumerableFromFile("tests-jmeter/content/js/dashboard.js");
        foreach (var line in dashBoardFile)
        {
            if (line.Contains(lineWhereApdexResultIs))
            {
                var match = Regex.Match(line, regexPatternToCaptureResult);
                var rawApdexResult = match.Groups[1].Value;
                _applicationPerformanceIndex = JObject.Parse(rawApdexResult);
            }
        }
    }
}
If something is wrong, the test fails. Thus we can use it to break on purpose our pipeline, avoiding bugs in production 🤩. Looking at the code above, you may have noticed an environment variable on it. It can trigger the test execution or not because you normally wouldn't have the outputs from JMeter. That is especially important when you want to control whether this test should be executed or not.
Conclusion
When I started my career as a developer, I wish I'd had this advice right from the start, so that's why I created this post. JMeter can help you learn even more programming topics such as concurrency, parallelism, threading, coroutines, and many others. In addition, it opens a new broad set of tools that are at our disposal. I hope it can help you in any way and, as always, feel welcome to post any question you have.
Posted listening to Time (Clock Of The Heart), Culture Club.